Power BI is an extremely powerful application for creating business and operational intelligence dashboards and reports. The Visio Visual in Power BI provides the great ability to utilise existing and new Visio documents, but there are some good practices that should be followed to ensure a successful integration. A free guide is available from https://bvisual.net/resources/power-up-your-visio-diagrams/ , one of the main issues is the need to reduce the shape count because the Visio Visual has a limit (currently 1,000 shapes).
The Visio Visual automatically suppresses shapes on the Data Graphic layer, and it has the ability to count only those shapes layers whose names begins with a # character.
The best way to change the layer of shapes is usually to edit the master shape because this can propagated to all of its instances if they have not already been modified within the page. However, not all shapes are instances of a master shape, and master instances may have been modified in the page already, so they may need to be updated.
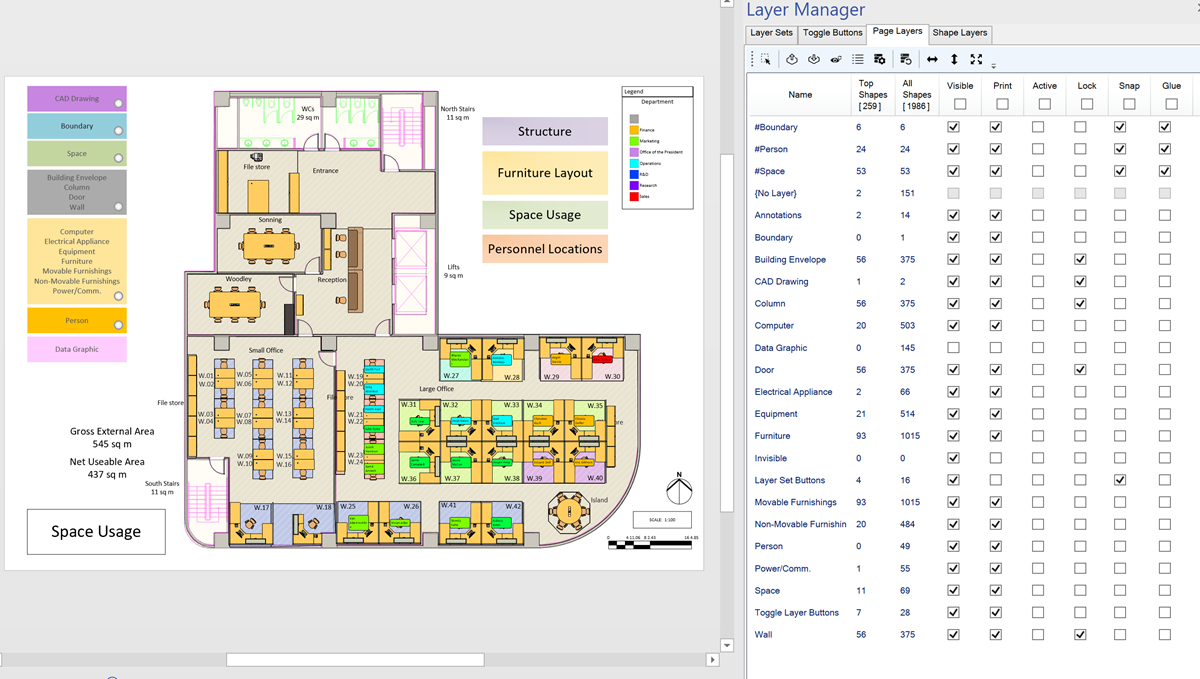
In the example of an office layout used here, there are nearly 2,000 shapes on the page, so it cannot be used in Power BI without reducing that shape count. Potentially, only the Boundary, Space and Person masters have shape instances that will be linked to data in Power BI, so these need to be considered.
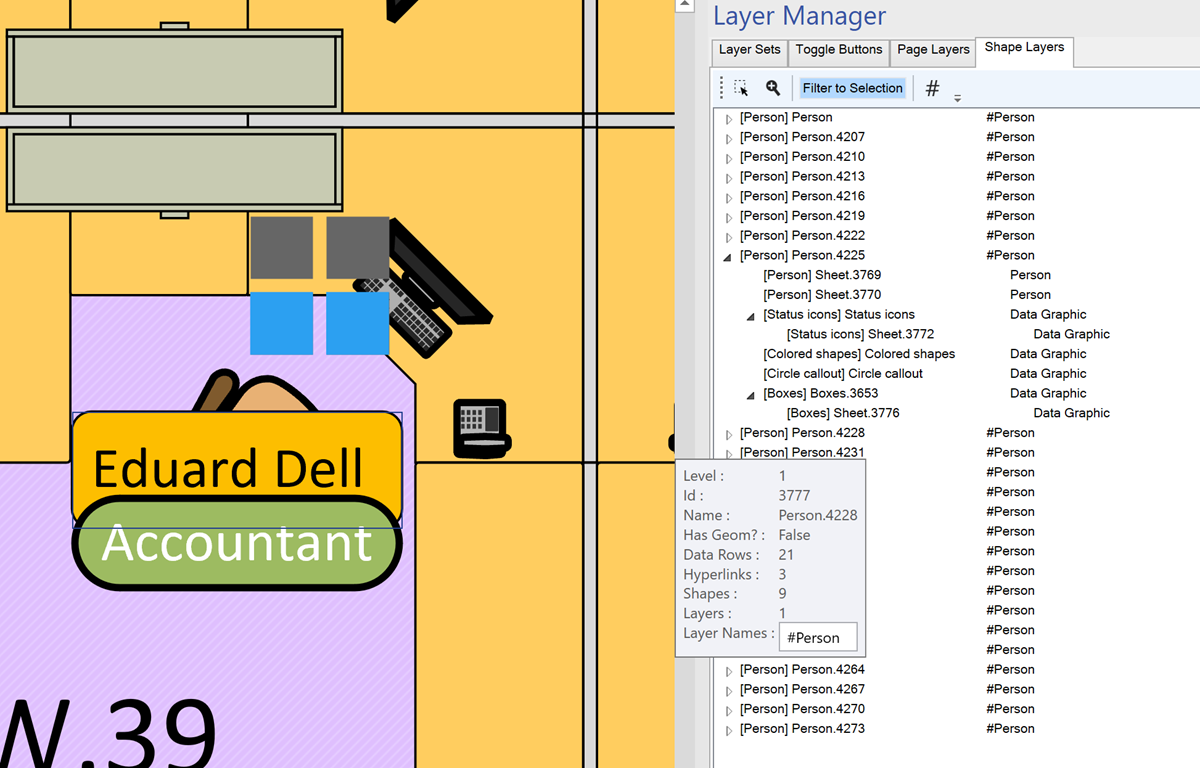
In the example below, each Person shape is actually comprised of 9 shapes, and although the Data Graphic sub-shapes will be ignored, that still leaves a count of three for each apparent Person shape instance.

Create a hash layer
If the Person master shape is edited using the built-in Assign to Layers dialog to rename the Person layer to #Person, then all three of the will be assigned to #Person. and thus there will be no reduction in the shape count for that layer.
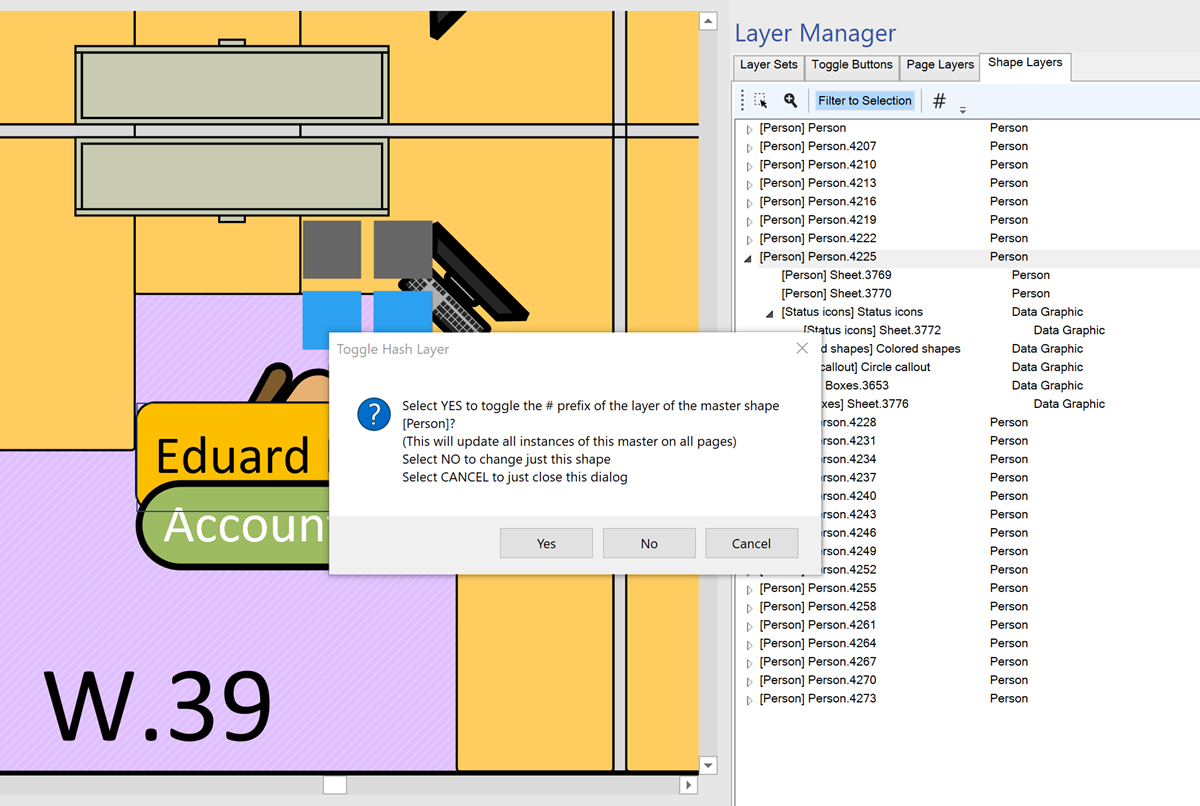
However, if the LayerManager Toggle Hash Layer tool is used, then only the top shape will be assigned to the #Person layer, and the sub-shapes are left on the Person layer.

Effect of hash layers
This is exactly what is required for the Visio Visual in Power BI, and if the same tool is applied to the Space and Boundary master shapes too, then the total count for the Visio Visual can be reduced to 83 (6+24+53) in this example.

Hashed layers reduce the shape count